Delivering Solutions
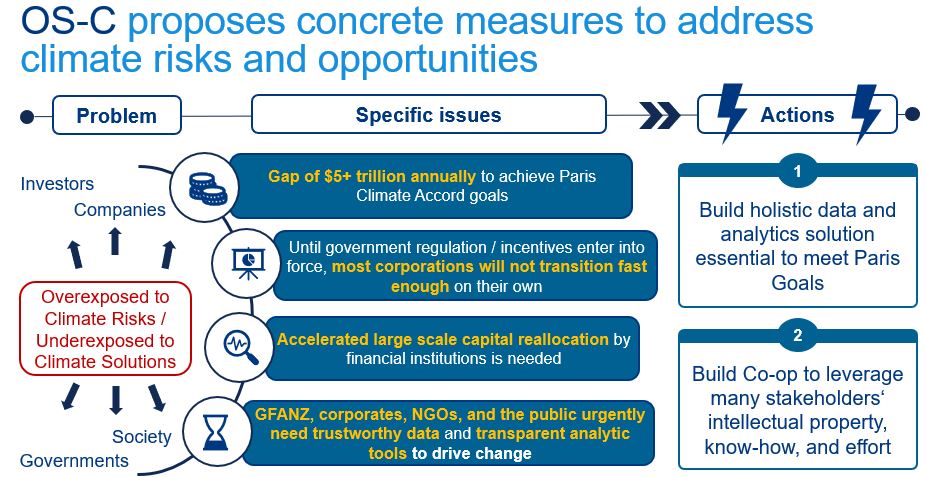
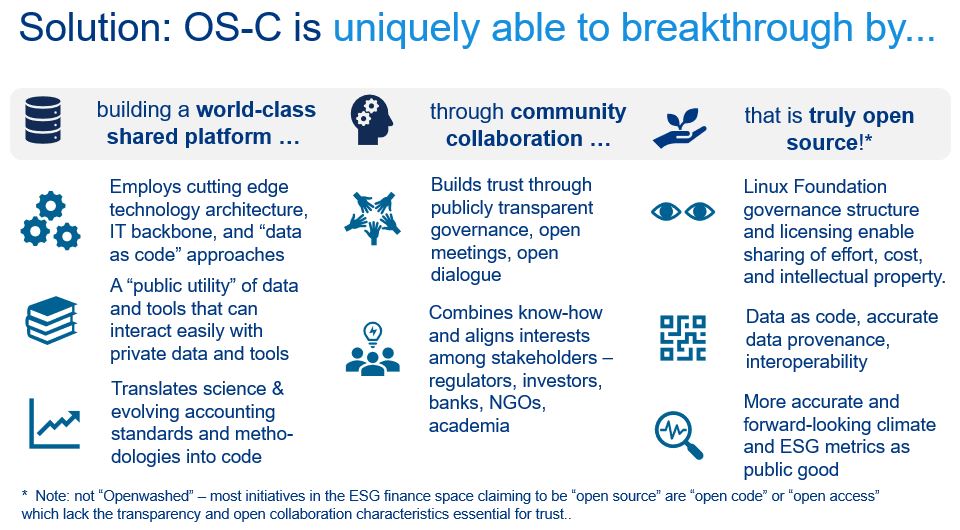
We are applying the Community-Based Open Source approach that has enabled breakthroughs in Life Sciences and Tech to tackle the data and analytics challenges required for a better understanding of the financial implications of climate risk.
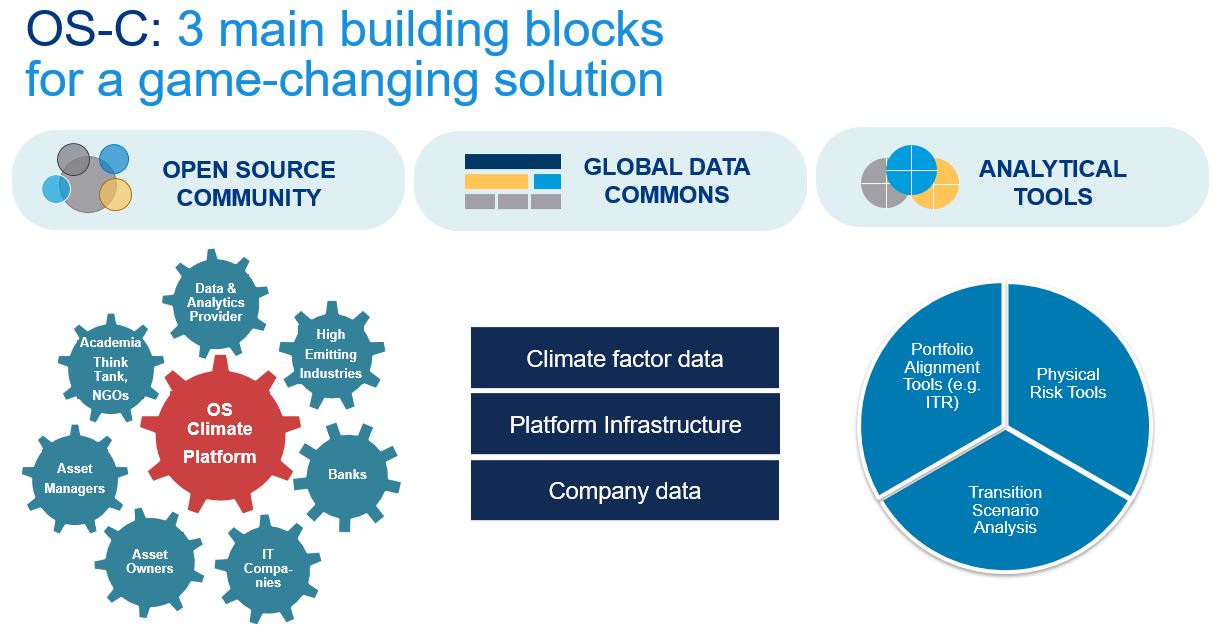
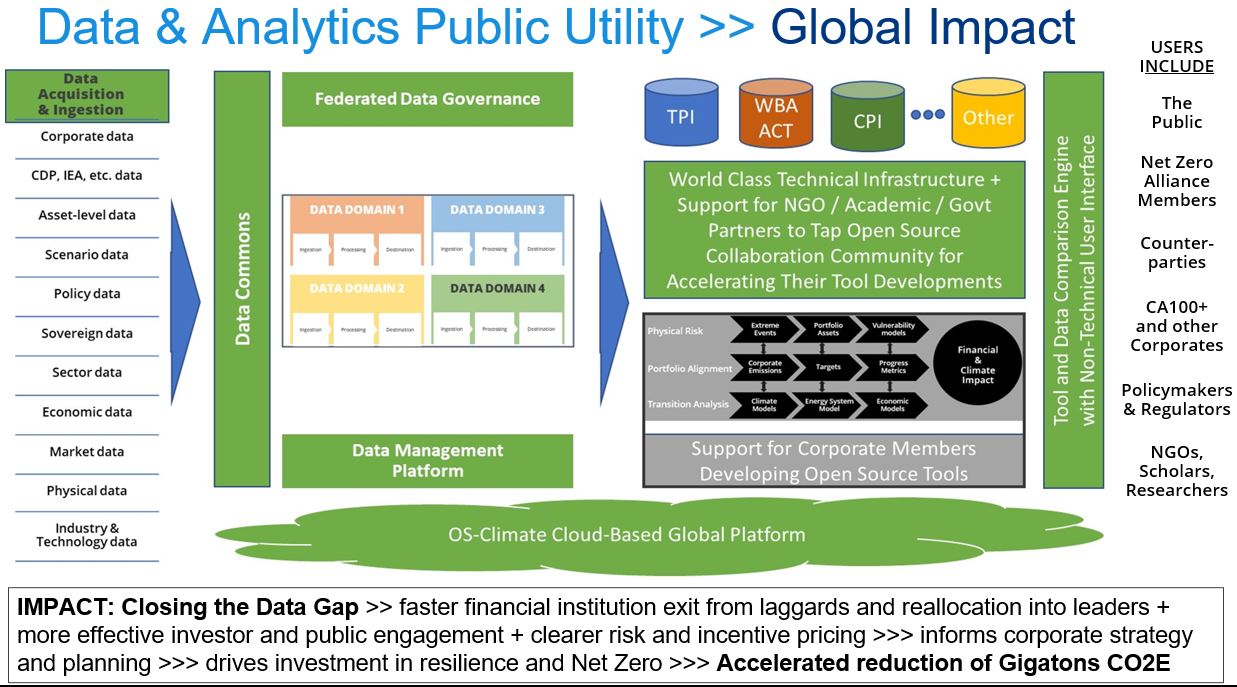
OS-Climate Planned Platform Components